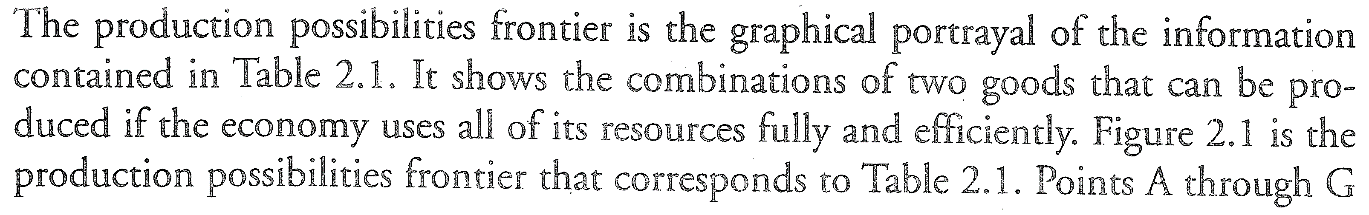
Production Possibilities Frontier
Graph that shows the combinations of amounts of two items that could be produced using the same resources
All points on the graph are points of efficiency
If you don't use all resources, then you have points of underutilization ( or inefficiency)
PPF Graph show alternative ways to use resources but does not show the best way because that is a normative issue.
Famous "Guns or Butter" Analogy
Government could use its resources to produce "guns" or military goods.
Government could use its resources to produce "butter" or domestic goods.
It highlights the trade-offs an economy faces in using scare resources.
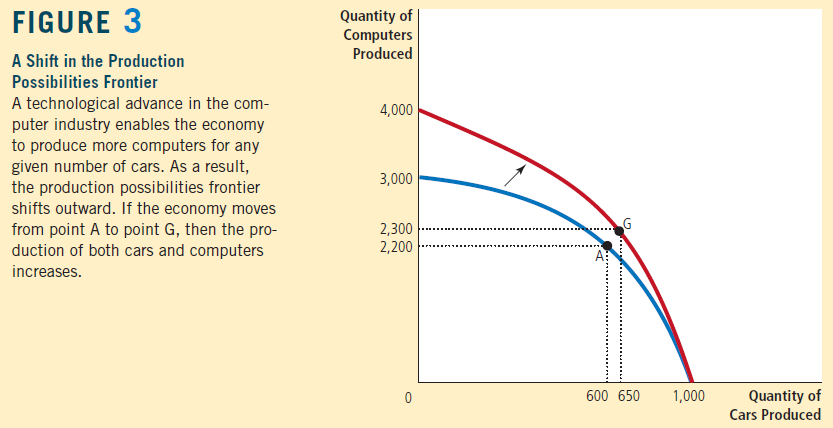
Shift in the Production Porribilities Frontier
Points outside the PPF may be attained at some future date because the frontier may shift so that points like J lie along the new frontier.
The frontier can also shift inward representing a change for the worse.
Factors that cause the PPF to shift:
changes in the amount resources in the economy
change in technology and productivity
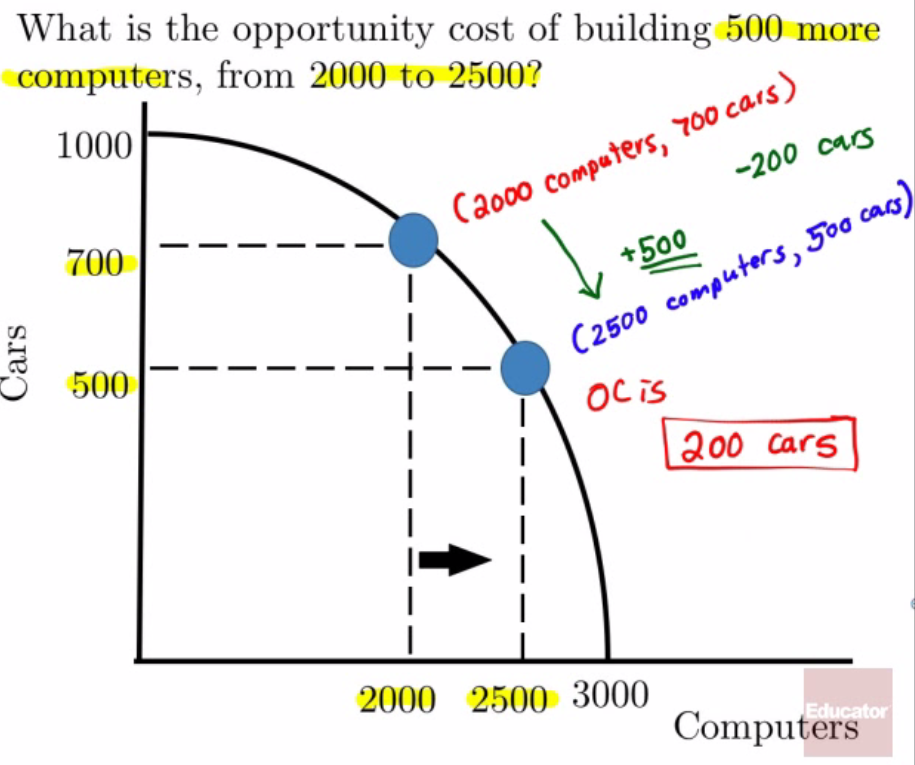
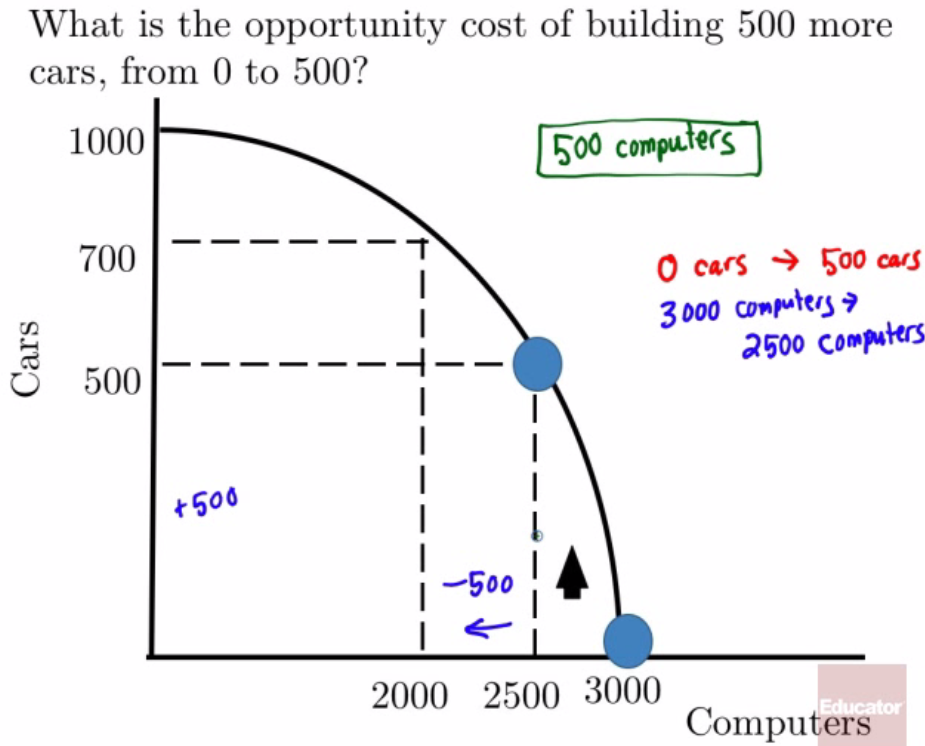
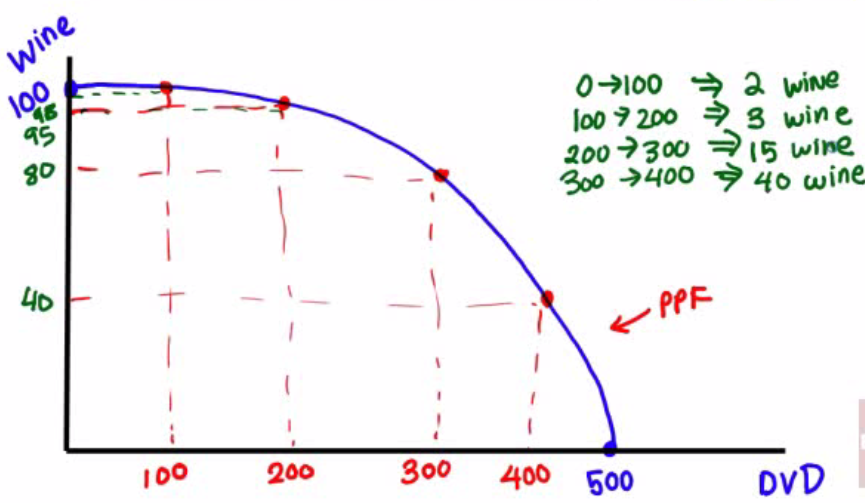
Increasing Opportunity Cost
More and more resources are required to produce the same amount of a product
Curve for this type of PPF graph will be concave.
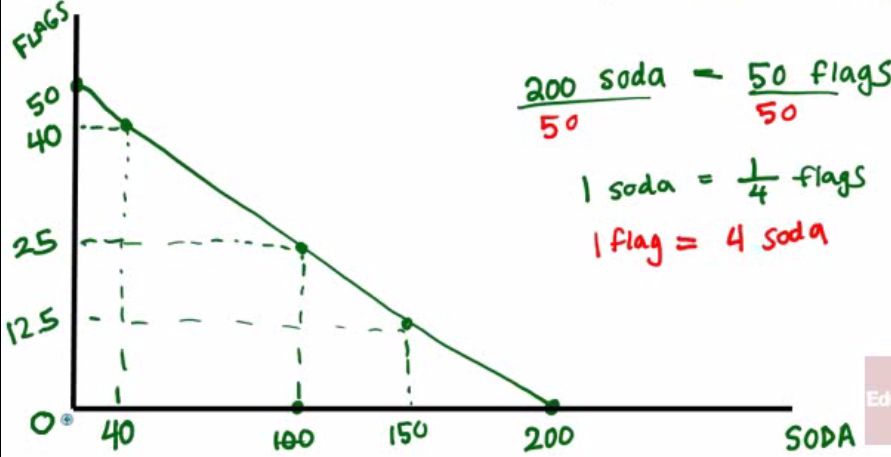
Constant Opportunity Cost
Same resources are required to produce a certain amount of a product
Product Possibilities frontier will be a downward-sloping line.
Opportunity cost and PPF graph