The Short-Run Phillips Curve
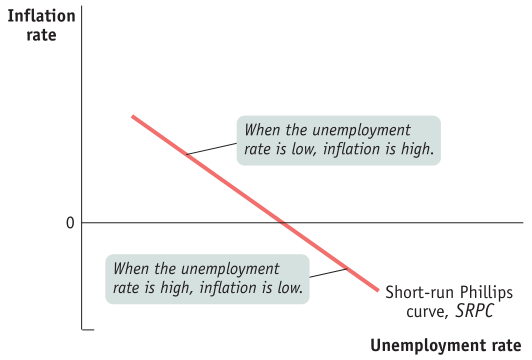
In 1958, New Zealand-born economist Alban W.H. Phillips found that when the unemployment rate was high, wage rates tended to fall
Conversely, when the unemployment rate was low, wage rates tended to rise
Using data in the 1950s and the 1960s, the simple negative relationship between inflation and unemployment generally held true
Graph
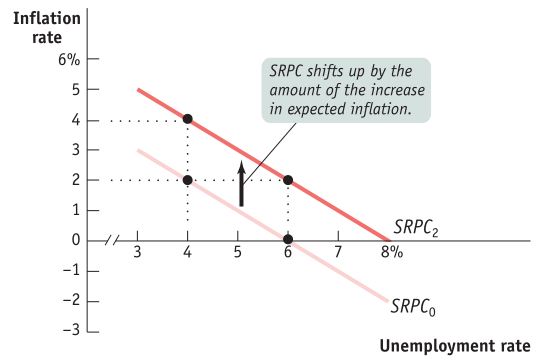
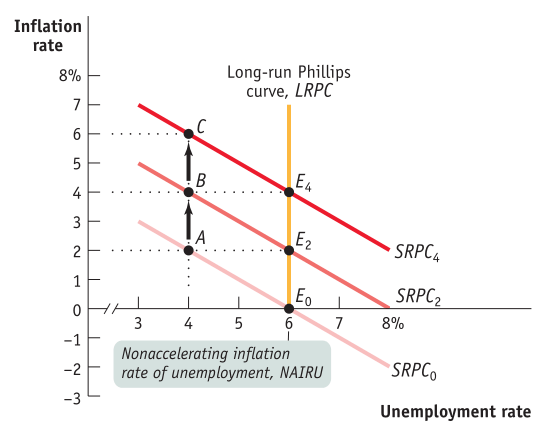
Inflation Expectations
Changes in expected inflation will affect the Short-Run Phillips Curve (SRPC)
An increase in expected inflation shifts the short-run Phillips curve upward
People will tend to base their expectations of inflation based on their experiences
When people were accustomed to low inflation rates, the correctly reasoned (at the time) that future inflation rates would also be low
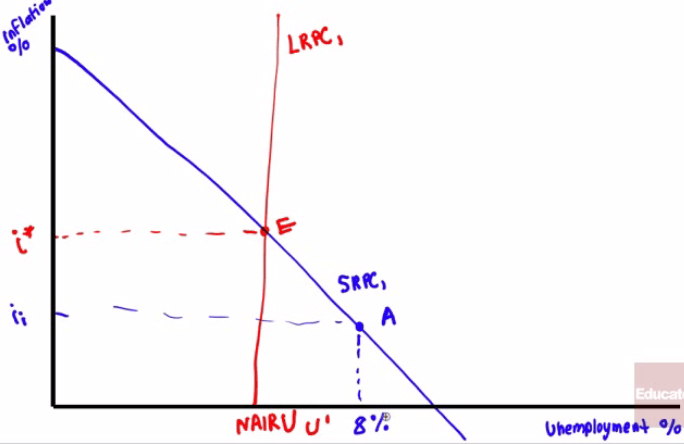
Inflation and Unemployment in the Long Run
Most economists believe that in the long-run, there is no trade-off between unemployment and inflation
To avoid accelerating inflation overtime, the unemployment rate must be high enough that the actual rate of inflation matches the expected rate of inflation
The unemployment rate at which inflation does not change over time is known as the nonaccelerating inflation rate of unemployment, or NAIRU
The Long-Run Phillips Curve (LRPC) is the relationship between unemployment and inflation after expectations of unemployment have had time to adjust over time
Graph
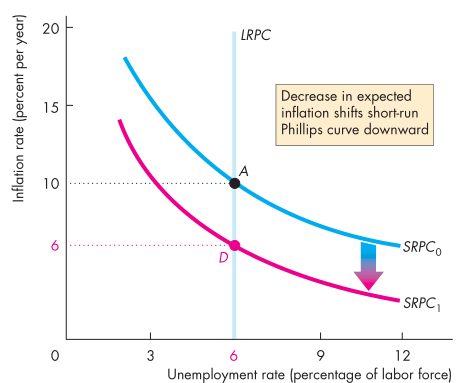
The Costs of Disinflation
Generally, politicians and economists have found that bringing inflation down is much harder than increasing it
In the early 1980s, the United States used contractionary policies which brought about disinflation
Policy makers reasoned that the long-term benefit of controlling double-digit inflation was worth the short-term pain that totaled an equivalent of nearly $2.6 trillion (2010 dollars)
A clear policy of announcing of policy of disinflation, some economists argue, helped in easing the pain
The Costs of Deflation
Deflation is the fall in the aggregate price level, which was a common occurrence before World War II in the United States
After WWII, inflation became the norm. But, in the 1990s, deflation reemerged in Japan
Why is deflation bad? Aren't lower prices good?
In deflation, lenders gain and borrowers lose since a dollar has more purchasing power in the future
The effect of deflation, ultimately, leads to a reduction of aggregate demand which, many economists will argue, played a significant role in the Great Depression
Practice Questions
An increase in expected inflation will do which of the following?
a. Shift the SRPC downward
b. Shift the SRPC upward
c. Shift the LRPC upward
d. Shift the LRPC downward
e. None of the above
Answer: b
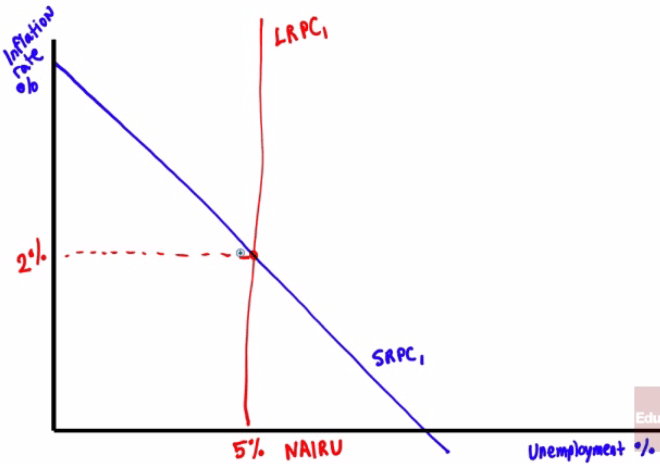
Draw a correctly labeled graph showing a SRPC with an inflation rate of 2% and the NAIRU at 5%
Assume an economy is in a recession. Draw a correctly labeled graph showing the following (SRPC, LRPC, and point A, which represents the current state of recession)