Real GDP Per Capita
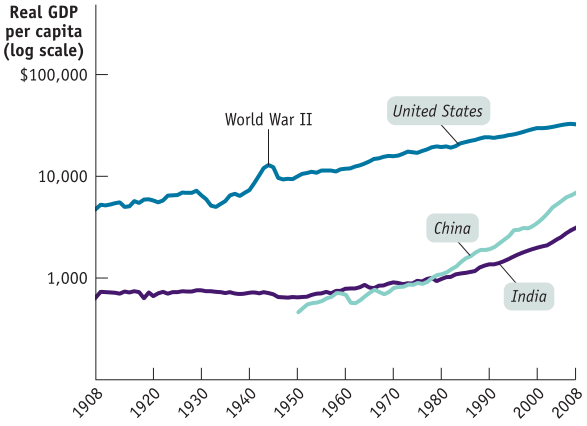
Key statistic used to measure economic growth and standard of living real GDP per capita
Real GDP divided by the population
Not a policy goal itself, but a useful summary that measures a nation's economic progress
In 2008, the median household income in the United States was ~$50,000
In 1908, it was about 15% of that, or ~$8,000 in today's dollars
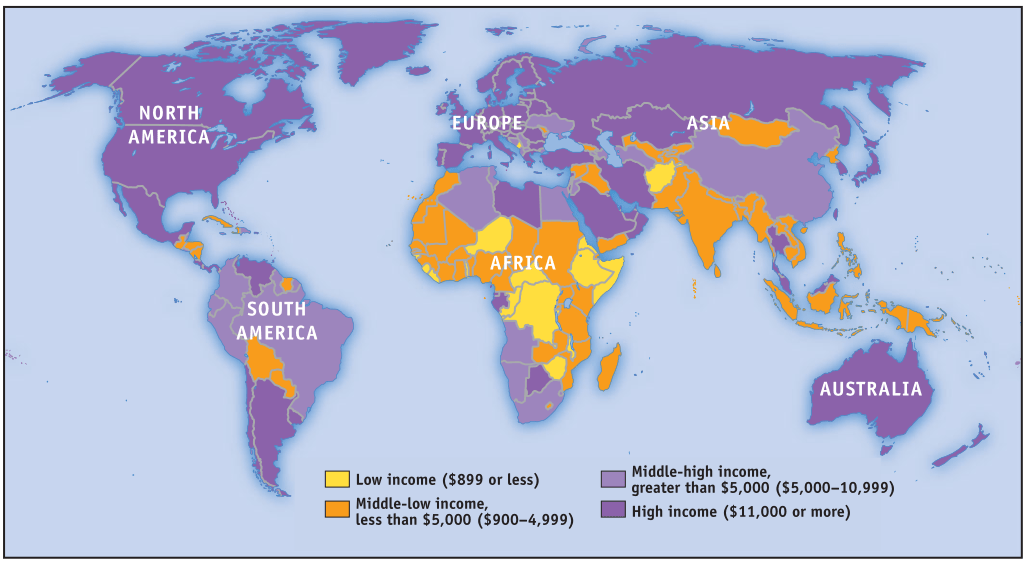
In many countries today, the standard of living is less than it was in the United States over 100 years ago!
Why is that?
Long Run Economic Growth
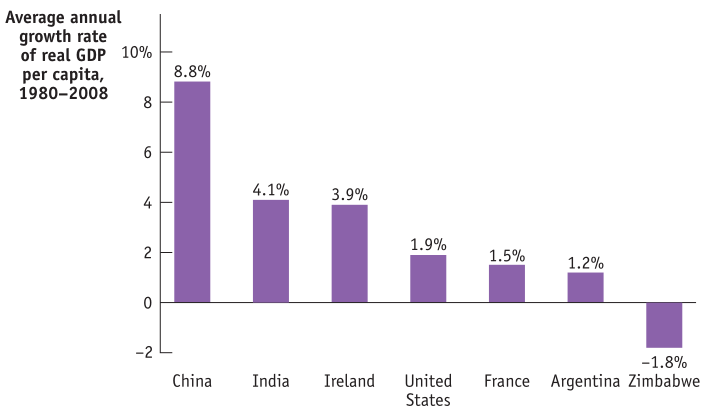
Gradual progress of the real GDP per capita in the US increased by 1.9% every year
Sources of Growth
Physical Capital
Building and machines today make the average worker much more productive
Human Capital
Improvement in labor created by education and knowledge in the workforce
Technology
- Technical means for the production of goods and services
Economic Growth on Graph
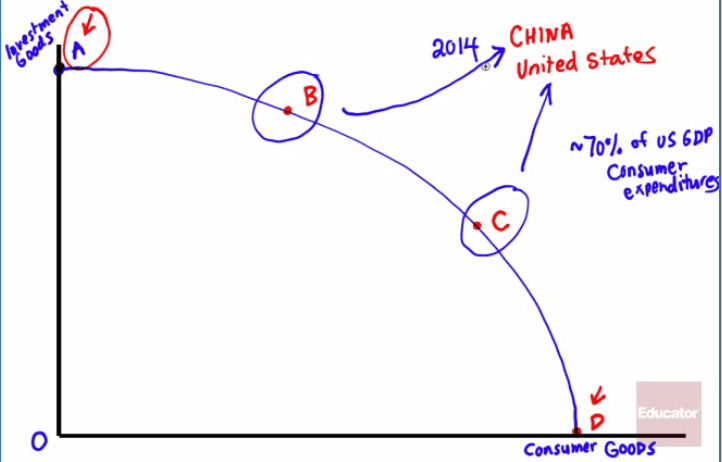
PPF Graph
- Economic growth results in an outward shift of the production possibilities curve.
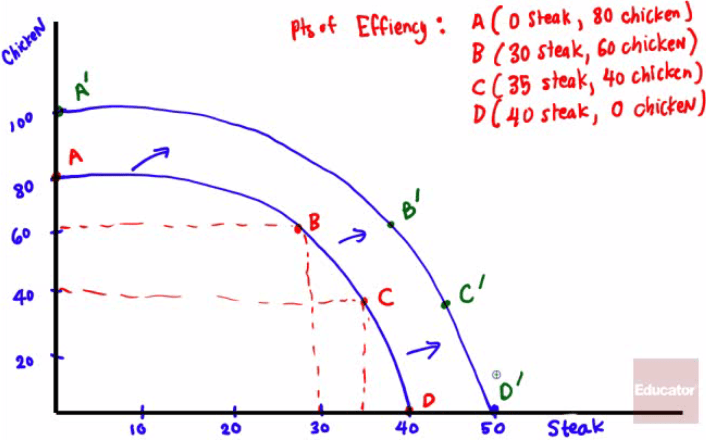
In Parkland, point A (y-axis) represents all investment goods and point D represents all consumer goods (x-axis) with B and C in between
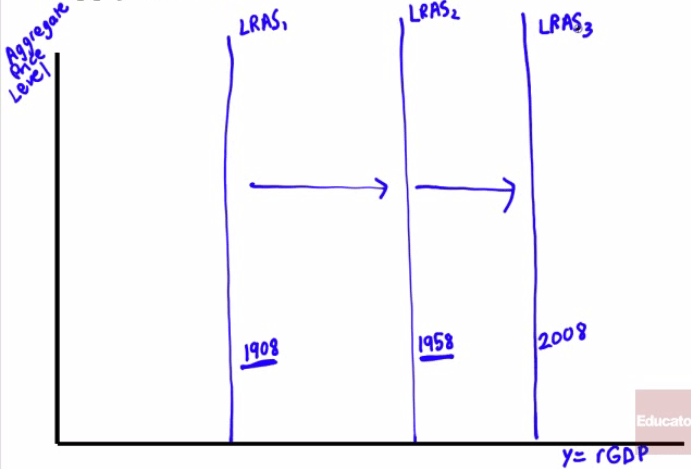
LRAS Curve
- The growth in potential output over time can be shown as a rightward shift of the long-run aggregate supply curve
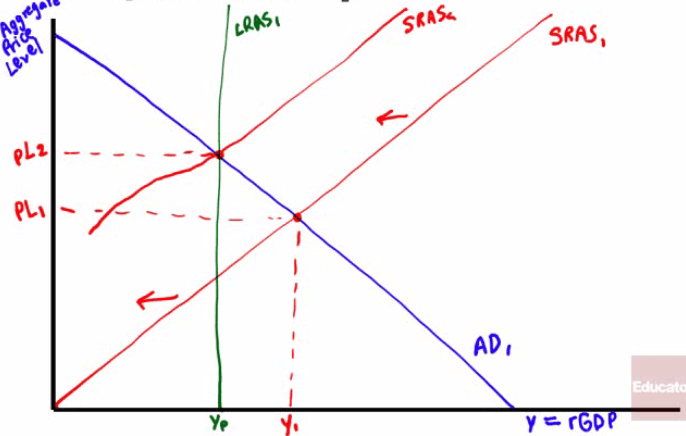
SRAS curve
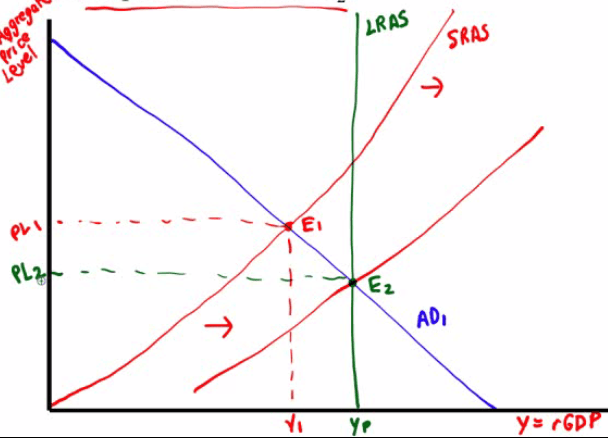
Short-Run to Long-Run: Y1 > YP
Initial equilibrium is E1. Eventually, low unemployment will cause nominal wages to rise and leads to a leftward shift of the SRAS curve, so the new equilibrium is at E2
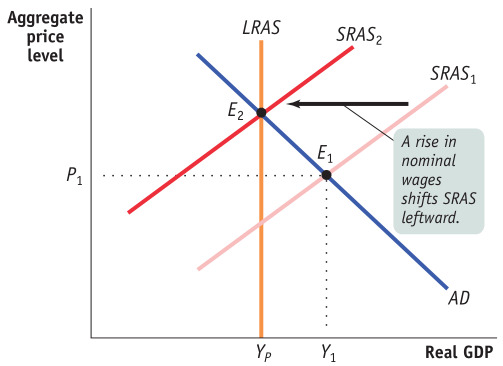
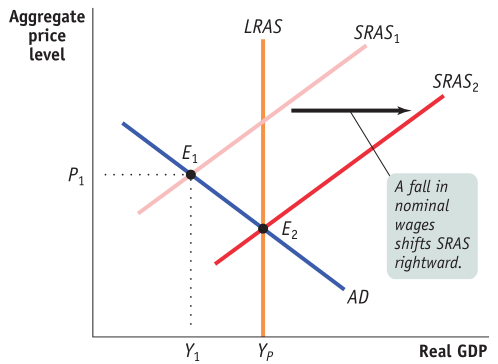
Short-Run to Long-Run: Y1 < YP
Initial equilibrium is E1. Eventually, high unemployment will cause nominal wages to fall and leads to a rightward shift of the SRAS curve, so the new equilibrium is at E2
Practice Questions
Long-run economic growth depends almost entirely on
a. Technological change
b. Rising productivity
c. Increased labor force participation
d. Rising real GDP per capita
e. Population growth
Answer: b
In the AD-AS model, long-run economic growth is shown by a
a. Leftward shift of the AD curve
b. Rightward shift of the AD curve
c. Rightward shift of the LRAS curve
d. Rightward shift of the SRAS curve
e. Leftward shift of the SRAS curve
Answer: c
Which of the following is listed among the key sources of growth in potential output
a. Expansionary fiscal policy
b. Expansionary monetary policy
c. A rightward shift of the short-run aggregate supply curve
d. Investment in human capital
e. All of the above
Answer: d