Understanding Exchange Rates
In general, stuff produced in a country will be paid for that country's currency
US pruducts will be paid in dollars
Japanese products will be paid in yen
European products will be paid in euros
British products will be paid in pounds
Foreign exchange markets
- market in which currencies are exchanged for each other in which exchange rates are determined
The Foreign Exchange Market
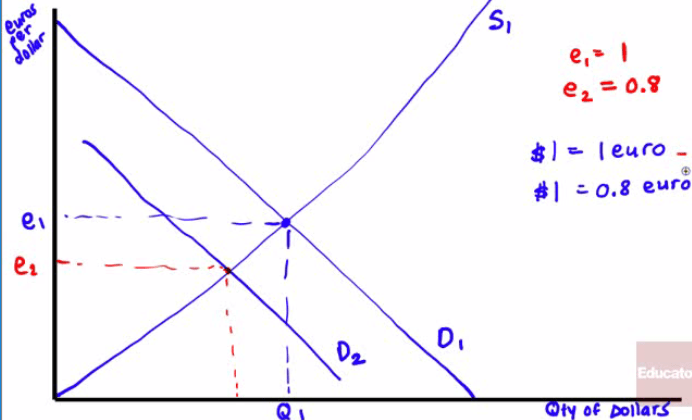
When the Euro was first introduced, 1 Dollar = ~1 Euro. What has happened since?
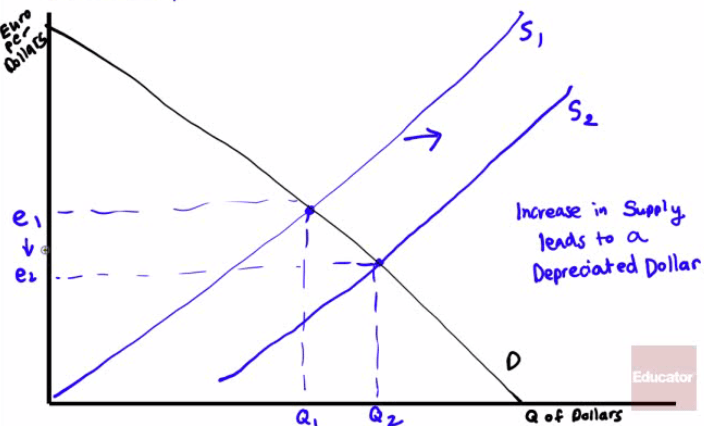
Show using quantity of US Dollars on the x-axis, and euros per dollar on the y-axis
Dollar has depreciated
Bad for US travelers to Europe
Good for US business
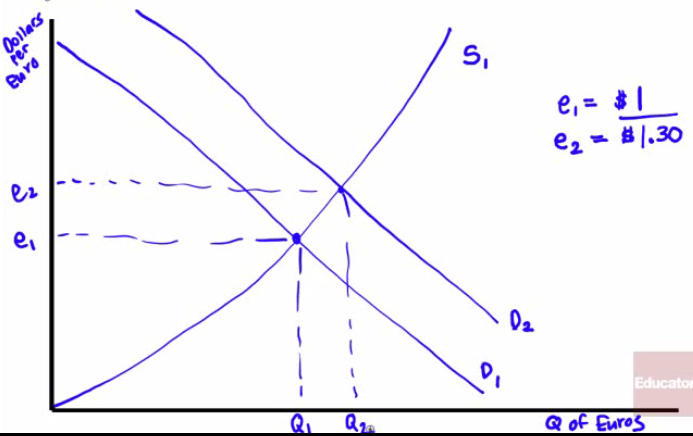
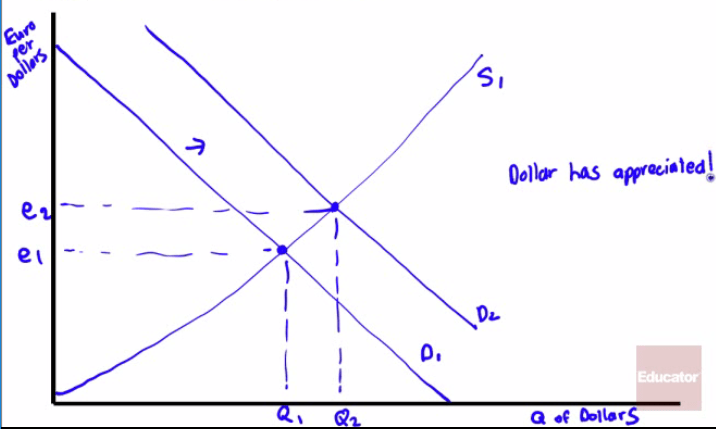
When the Euro was first introduced, 1 Euro = ~1 Dollar. What has happened since? Show using quantity of Euros on the x-axis, and Dollars per Euro on the y-axis
Euro has appreciated
Europeans travelers to the US can purchase more stuff
European business now will export less, because their products are more expensive, relative to US business
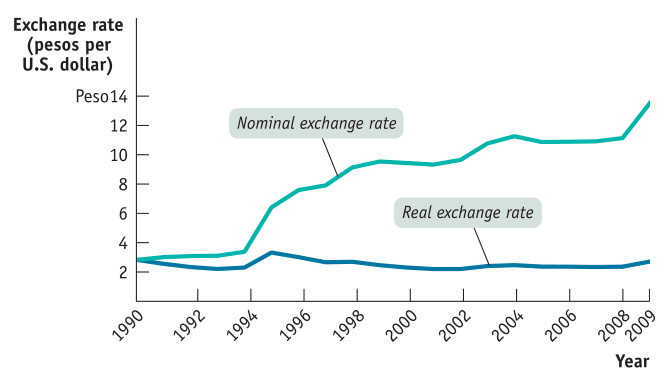
Inflation and Real Exchange Rates
In 1990, 1 US Dollar = 2.8 Mexican Pesos
In 2010, 1 US Dollar = 12.8 Mexican Pesos
Why?
Inflation in Mexico was much higher than US inflation
Real exchange rates take into account the impact of inflation in both countries
The current account responds only to changes in the real exchange, not the nominal exchange rate!
It still makes sense, however, to hold onto the currency with lesser inflation
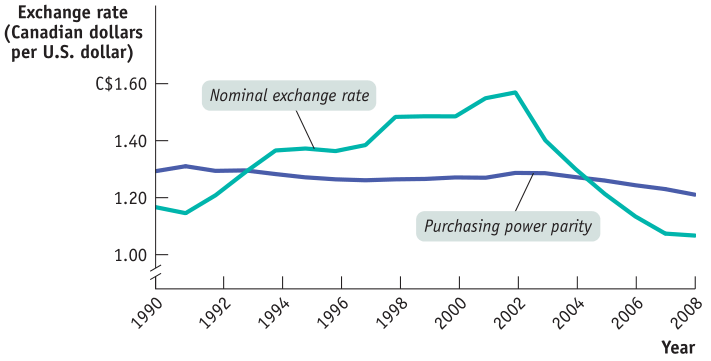
Purchasing Power Parity (PPP)
Useful tool for analyzing interest rates is a concept known as purchasing power parity
The purchasing power parity or PPP between two countries' currencies is the nominal exchange rate at which a given baskets of goods and services would cost the same amount in each country
In theory, you "should" be able to buy $100 worth of stuff in any country
For example, if 1 pound = 2 dollar, then $100 in the US should buy the same amount of stuff that 50 pounds would get you in the UK
Over the long run, purchasing power parities do a good job of predicating the nominal exchange rates
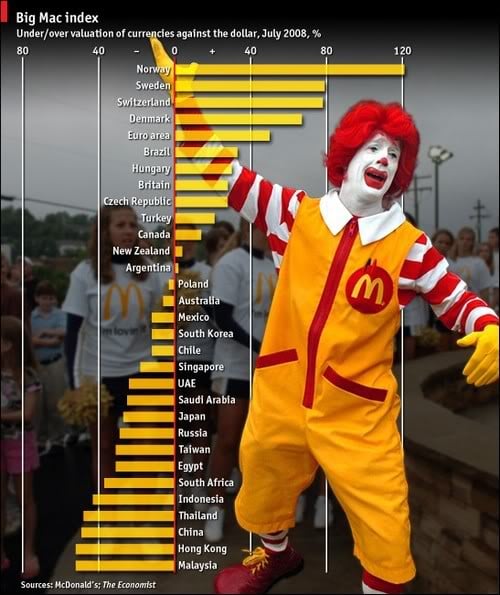
Burgernomics
The Big Mac index was first published in 1986 as an example of PPP, using the Big Mac as the benchmark
Not the best measure, as Argentina is not included because it did not want to be part of the 100+ countries on the list
In India, the $1.54 Big Mac is a Big Mac made of chicken, so is it really a Big Mac?
In 2014, a Big Mac in the US sells for $4.62 which is remarkably close to what it costs in the United Kingdom at $4.63
Overvalued Big Macs: Norway, Sweden, Denmark, Brazil, Switzerland
Undervalued Big Macs: Chinese yuan, Russia ruble, South African rand, Mexican peso, Indian rupee
Floating vs. Fixed Exchange Rate Regime
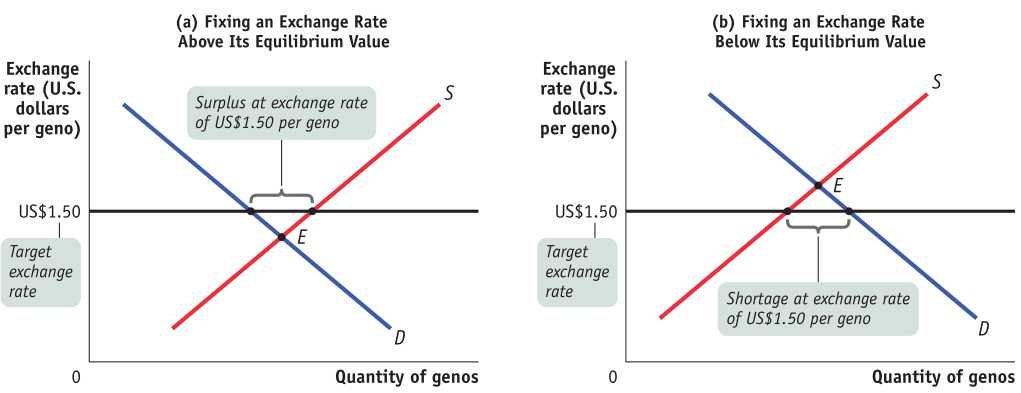
Fixed exchange rate
When the government keeps the exchange rate against some other currency at or near a particular target
Hong Kong sets an exchange rate of 7.80 HK Dollars to 1 US Dollars
Through manipulation of supply and demand, countries can
If the equilibrium is lower than the target rate, the government will buy currency to prop it up
If the equilibrium is higher than the target rate, the government will sell the currency to keep it from rising
Floating exchange rate
- The exchange rate goes where the market takes it (ie. United States, UK, Canada)
Exchange Rate Dilemma
Fixed rate regimes give predictability to trade partners as business with the United States operates as such, as do European countries adopting the Euro (ie. Italy, France, Germany)
Every choice has a cost!
Countries keep large quantities of foreign currency on hand at low return
Monetary policy is diverted to maintaining exchange rates
You give up use of monetary policy (as European countries did in adopting the Euro)
Practice Questions
On a Foreign Exchange Market Graph, what happens if capital flows from Europe to the United States has increased? Has the dollar appreciated or depreciated?
On a Foreign Exchange Market Graph, what would happen if there was an increase in US demand for imports from Europe? Has the dollar appreciated or depreciated?
Which of the following is a benefit of a fixed exchange rate regime?
a. Certainty about the value of domestic currency
b. Commitment to inflationary policies
c. No need for foreign exchange reserves
d. Allows unrestricted use of monetary policy
e. All of the above
Answer: a