Question 6
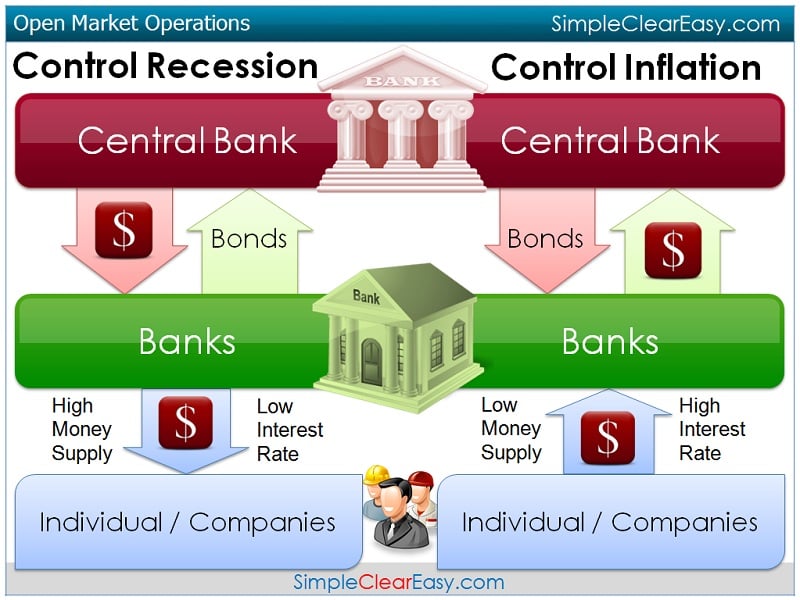
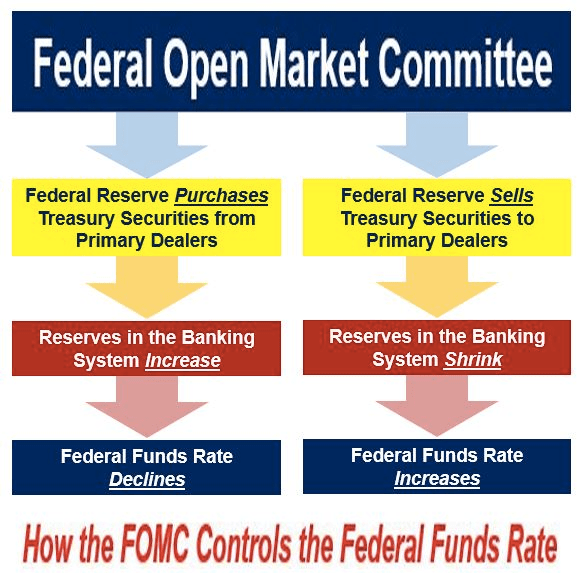
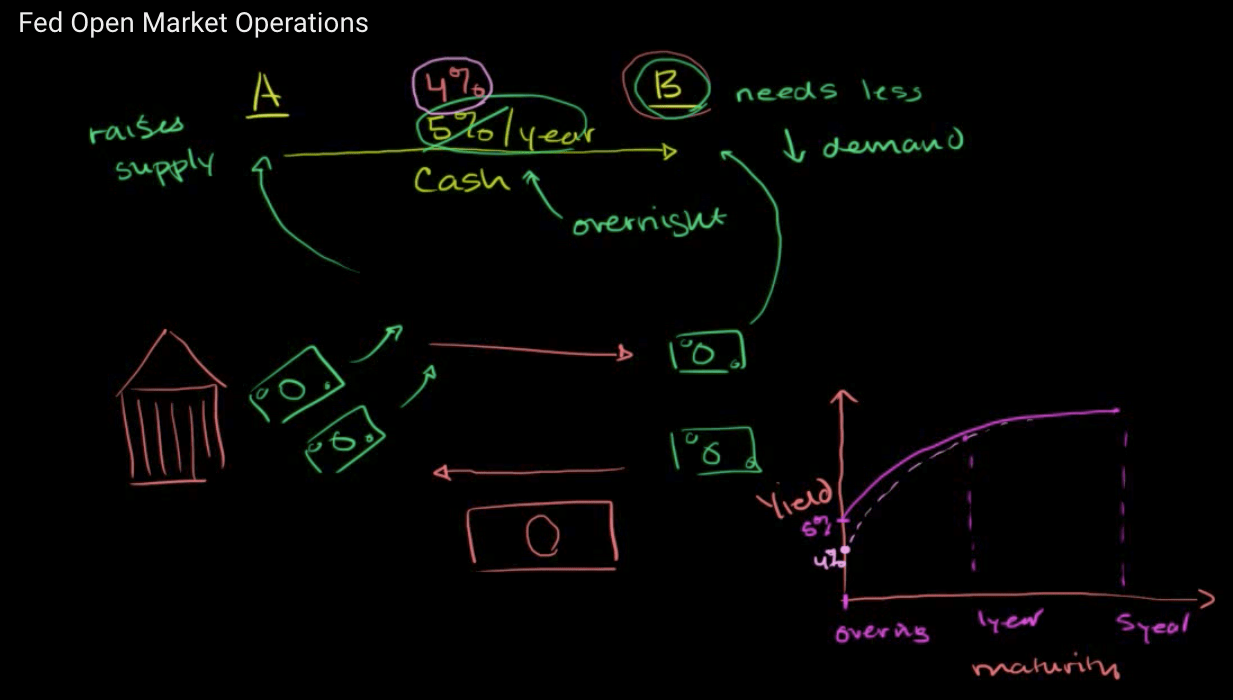
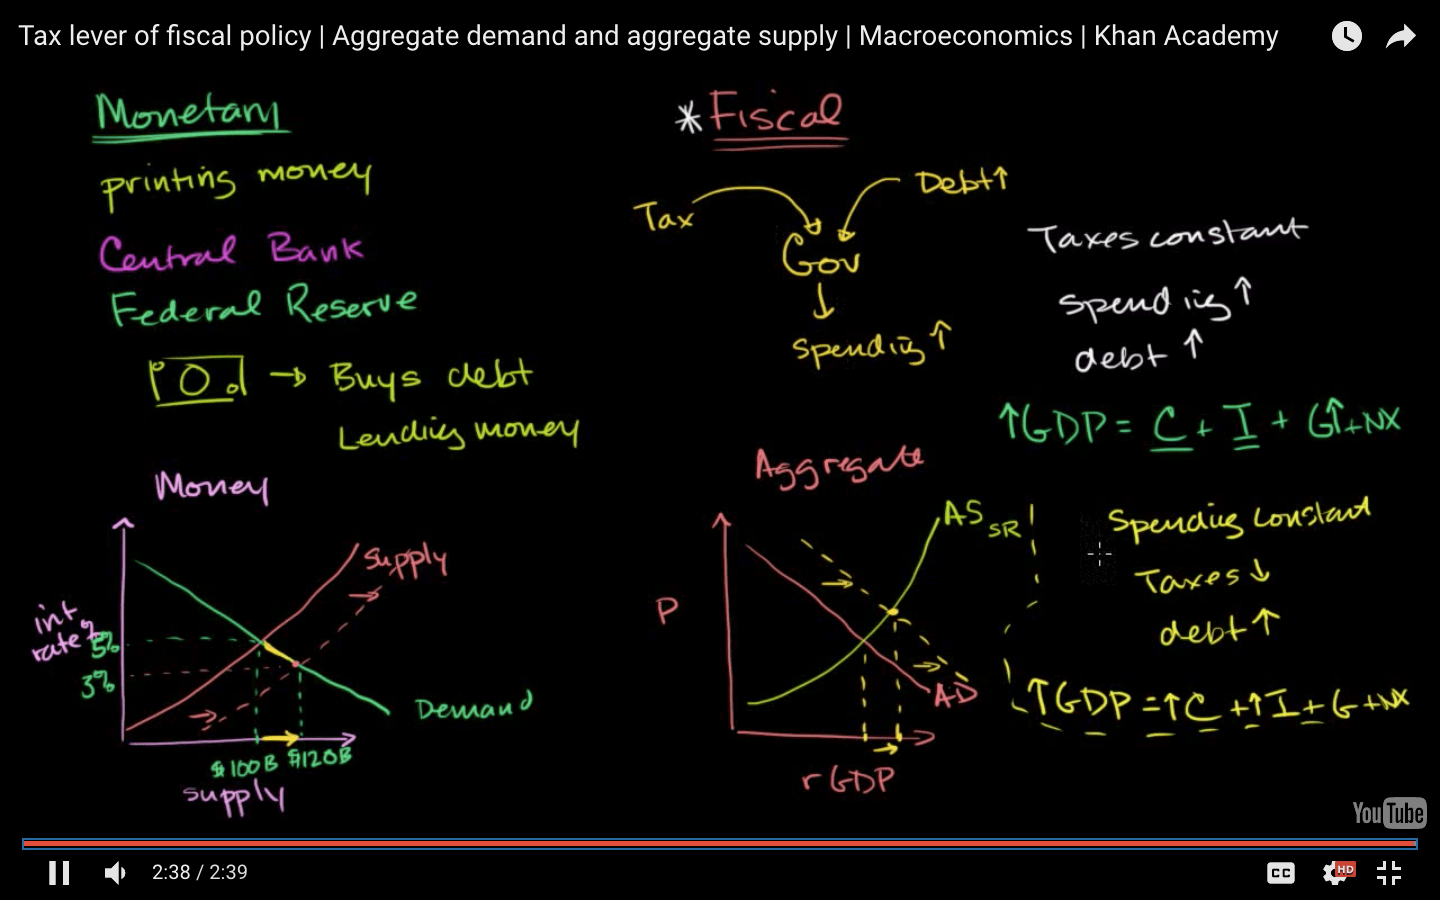
Purchase bond --> decrease the interest rate
Purchase bond --> bloat the economy = increase the inflation rate --> promote the employment
Question 7
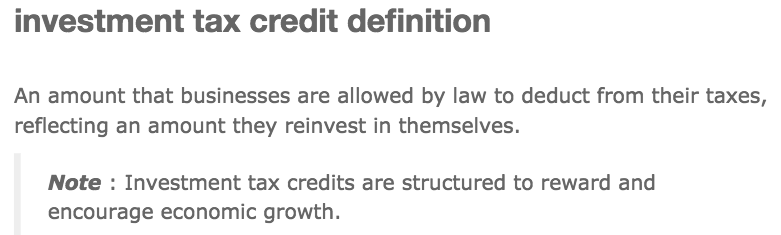
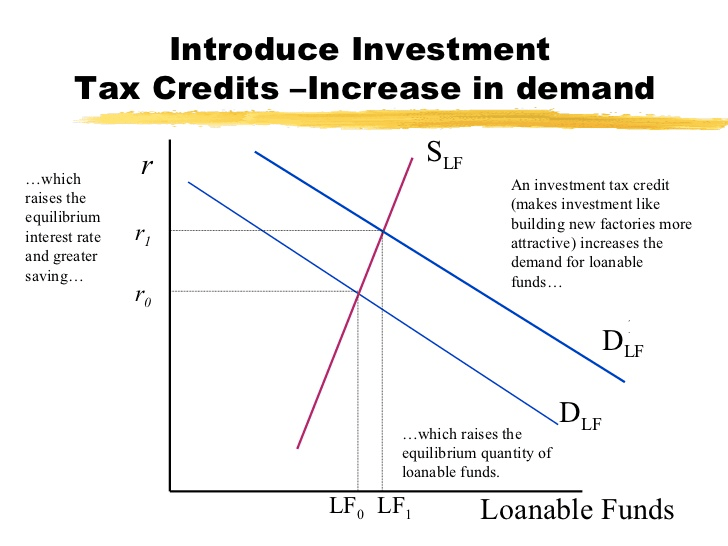
Investment tax credits
Question 10
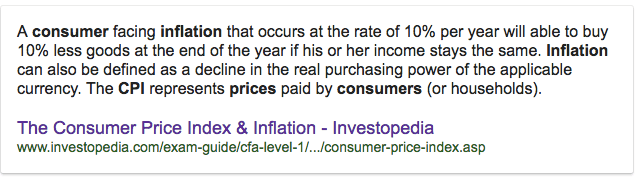
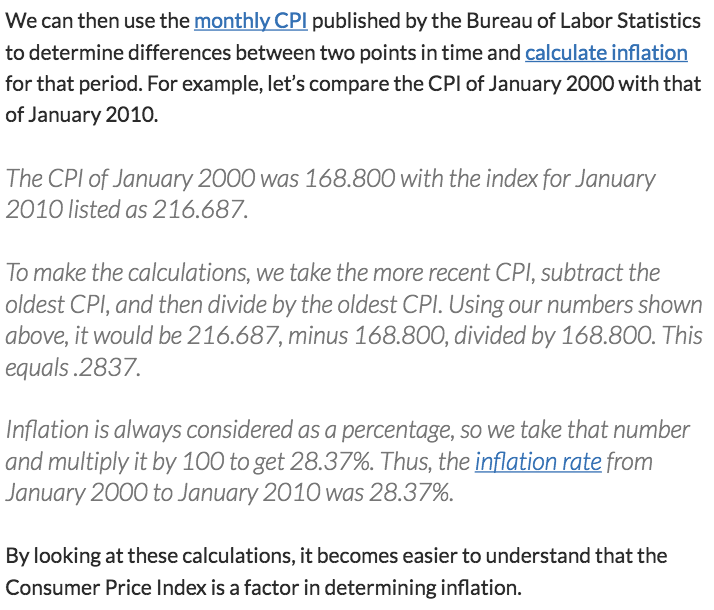
Consumer Price Index and Inflation
Question 12
Question 25
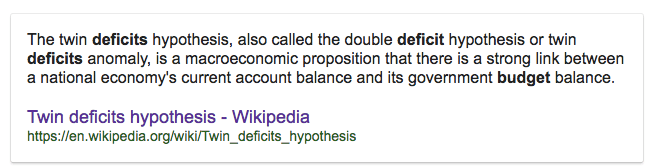
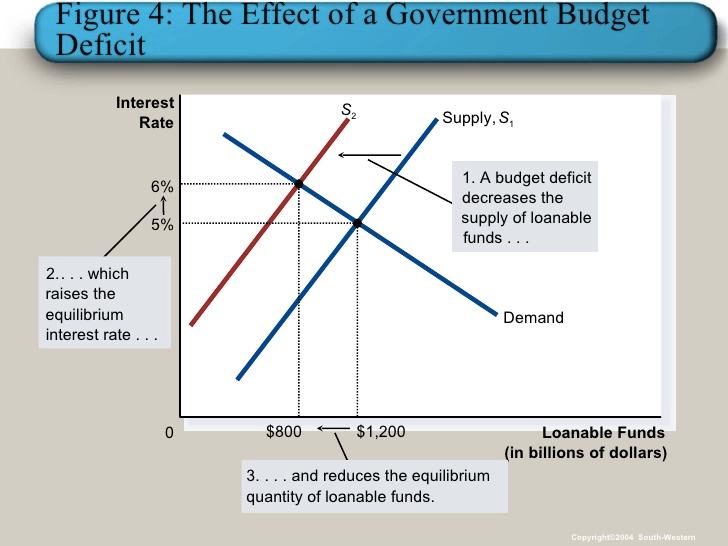
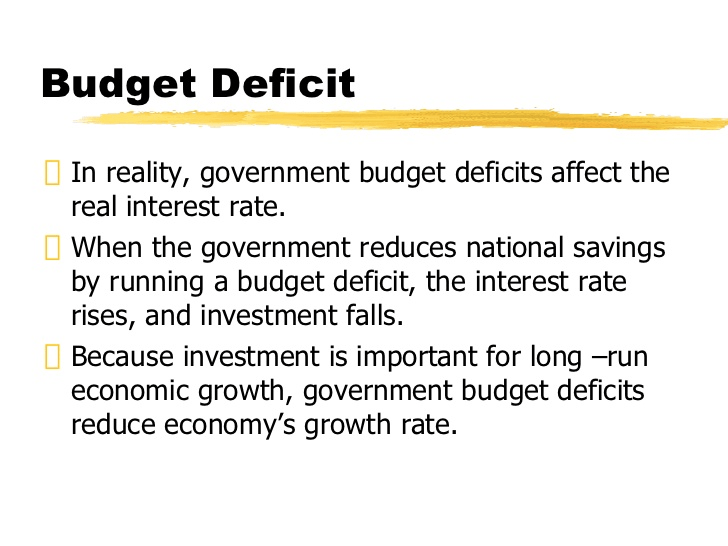
Budget deficit and interest rate
Question 26
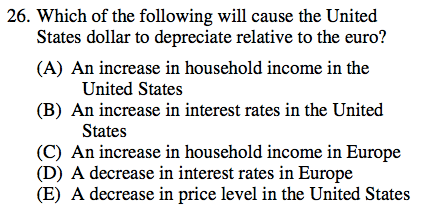
- Increasing household income in the U.S. results in more demand for foreign goods which appreciates that currency and depreciates the dollar.
Question 27
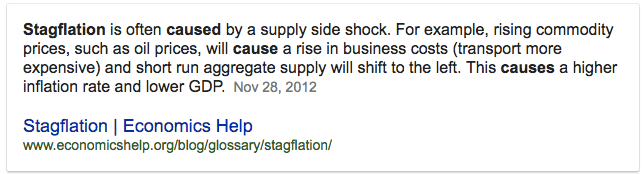
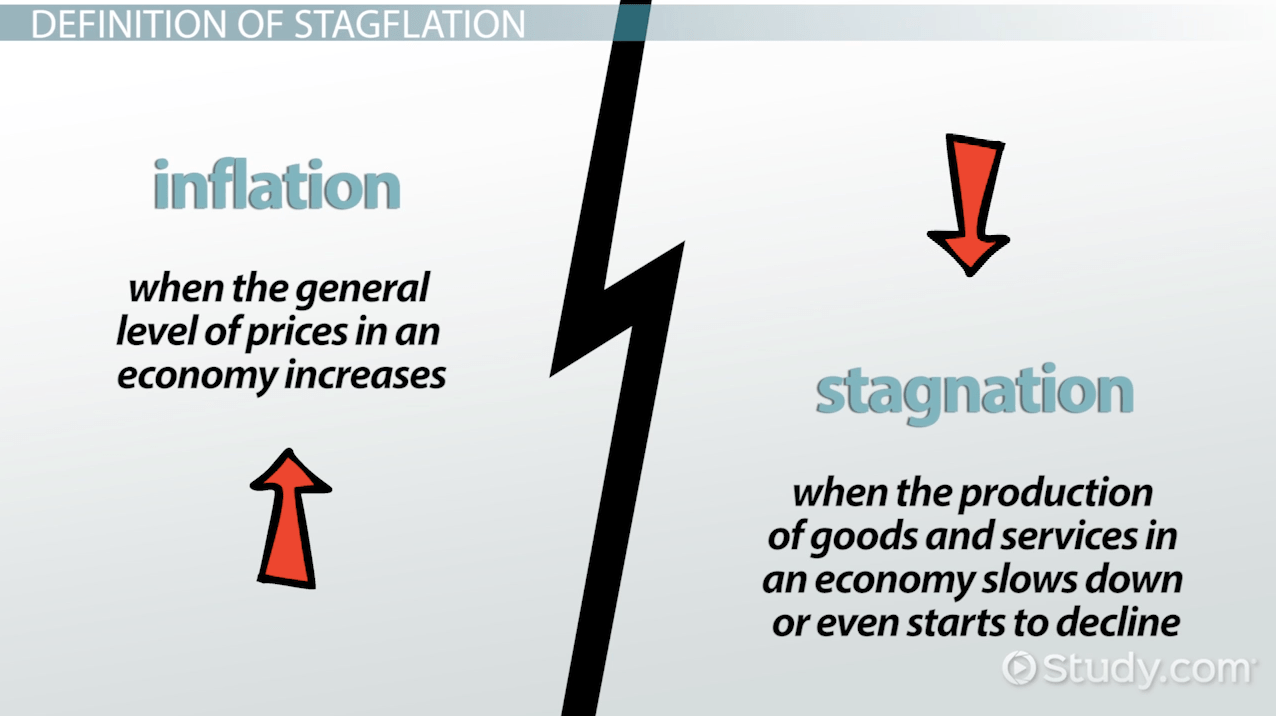
Causes of Stagflation
If the prices of raw material and labour increases, it will increase the cost of production prices will rise and output will fall.
Rapid rise in indirect taxes also increase the cost and price level. So output and employment falls.
Shortage of labour also affects the output adversely.
Question 34
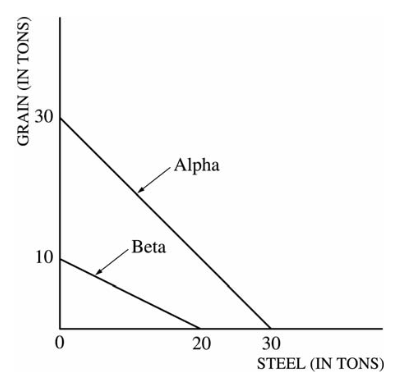
Alpha is getting 1 S domestically for their 1 G, but now they can trade their 1 G for 1.5 S.
Beta is having to give up 2 S to get 1 G domestically, but if they trade they only have to give up 1.5 S to get 1 G.
Question 35
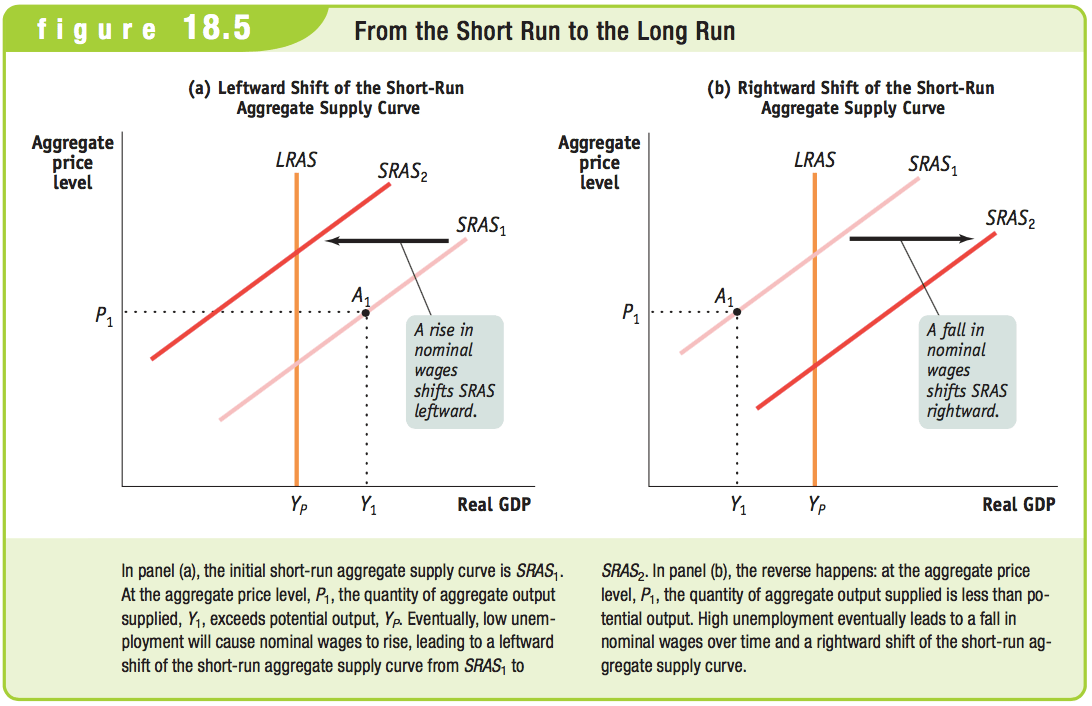
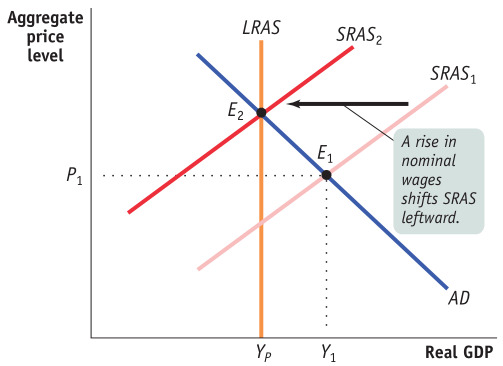
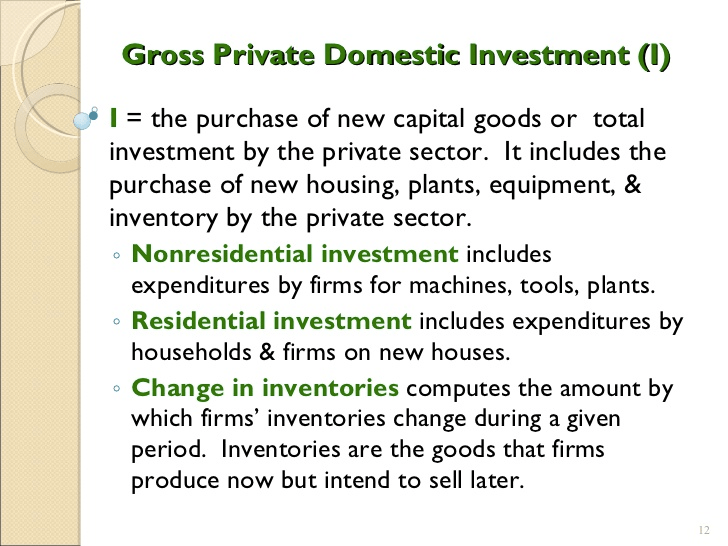
Short-Run to Long-Run: Y1 > YP
- Initial equilibrium is E1. Eventually, low unemployment will cause nominal wages to rise and leads to a leftward shift of the SRAS curve, so the new equilibrium is at E2
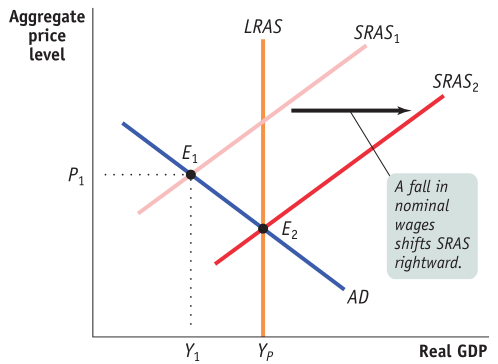
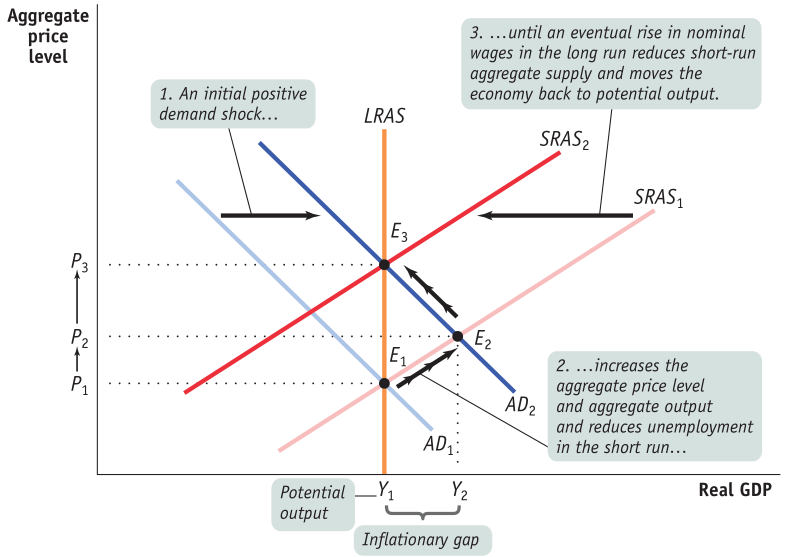
Short-Run to Long-Run: Y1 < YP
- Initial equilibrium is E1. Eventually, high unemployment will cause nominal wages to fall and leads to a rightward shift of the SRAS curve, so the new equilibrium is at E2
Question 37
Question 40
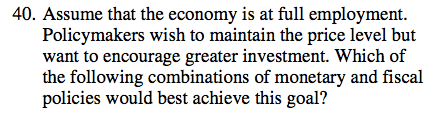
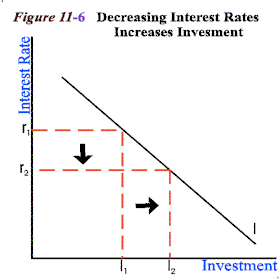
Expansionary monetary policy would result in lower interest rates, causing more investment in real capital.
To keep prices from going up, policymakers could cut G or raise taxes [contractionary] to prevent this.
Question 42
- Lower production costs --> more profits + shifts the AS to the right --> lower price level + increase in real output
Question 43
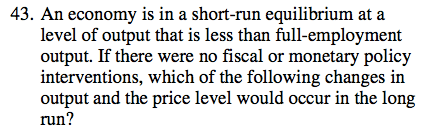
With no intervention in this recession, the surpluses would result in lower prices
- Workers would then accept lower wages. As more are hired back, output would increase.
Question 47
Decreasing taxes would increase C, increase AD and real GDP. Assuming a balanced budget before the decrease in T means the G would have to borrow, pushing up interest rates.
Decreasing the discount rate would also lead to more real GDP but would result in a lower interest rate.
With interest rates moving in opposite directions with the two policies, this make them indeterminate.
Question 53
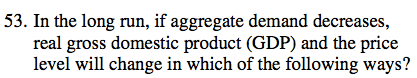
The decrease in AD resulted in surpluses & caused prices to drop.
Workers would now accept lower wage increases which moved the SRAS curve right, increasing real GDP.
Question 56
Question 57
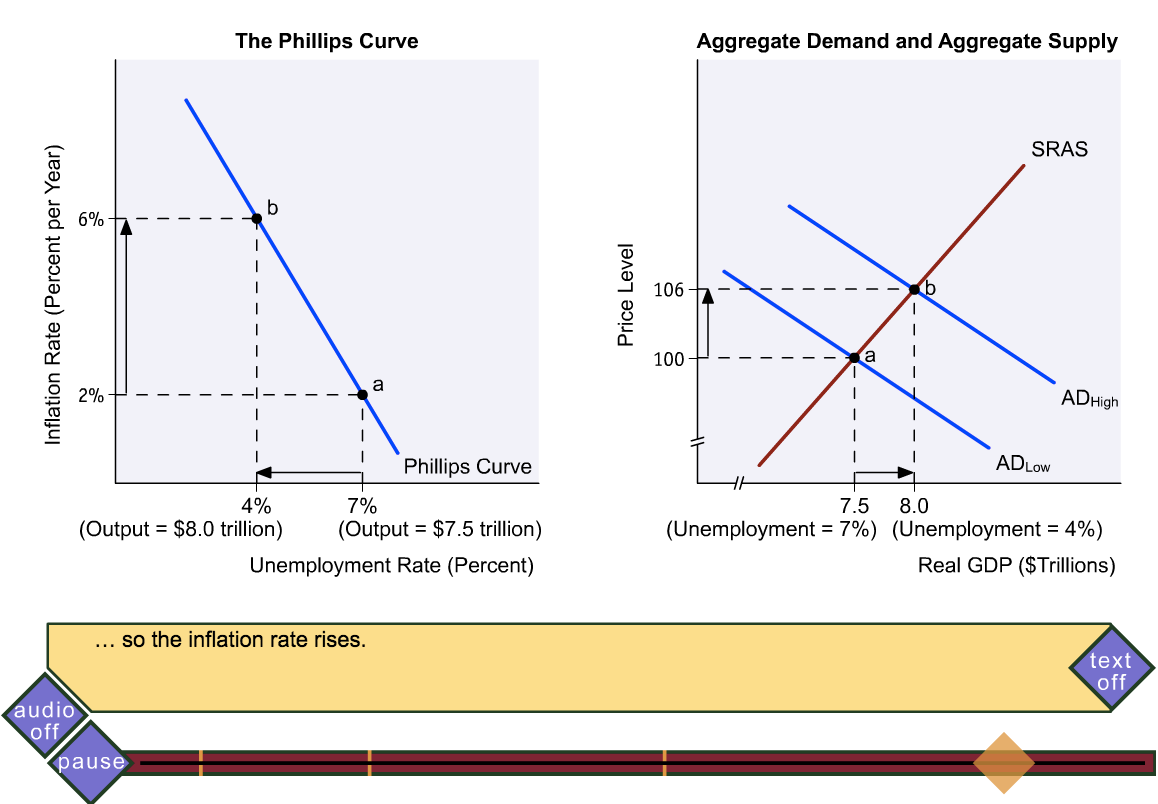
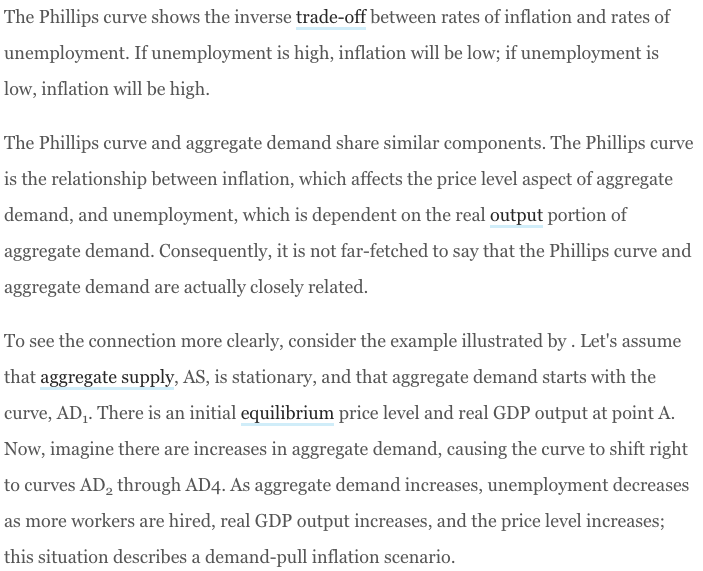
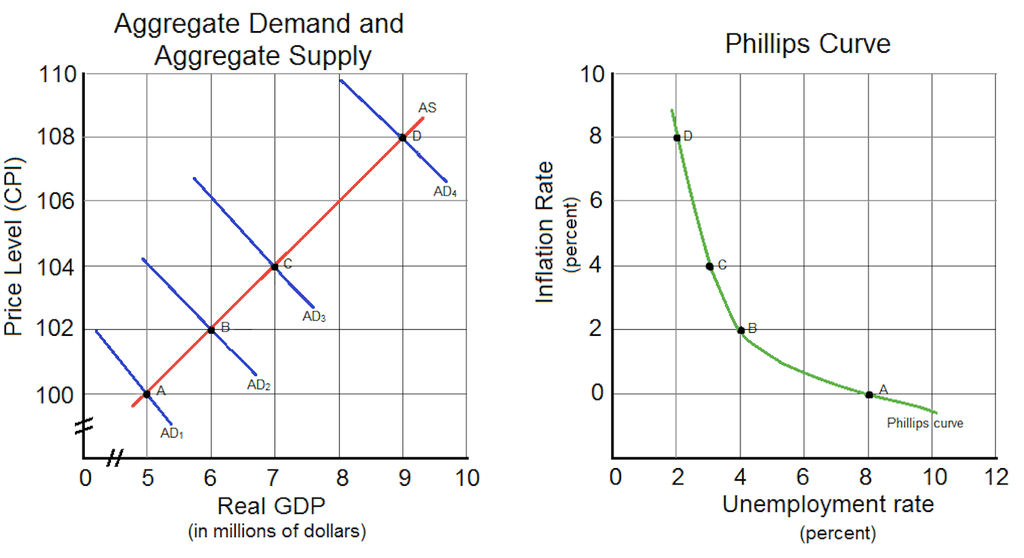
The Relationship Between the Phillips Curve and AD
Question 59
Business taxes are determinants of both AD and AS.
The decrease in business taxes means they have more profits and will invest more, increasing AD.
As far as the legal-institutional environment with the government, it is more favorably so that will result in an increase in AS
Question 60
The budget deficit means the government is borrowing more, which pushes up the interest rate.
The higher interest rate attracts more foreign investors, increasing demand for the dollar and appreciating the dollar.
The stronger dollar makes our exports more expensive and imports cheaper, therefore increasing the trade deficit.